by Marina Budrys | High School Humanities Faculty Member
Rudolf Steiner believed that it is really important to understand how things work in the world in some basic way. This doesn’t mean, for example, that we all need to know how to build an Audi TT engine, but some experience with acceleration is important.
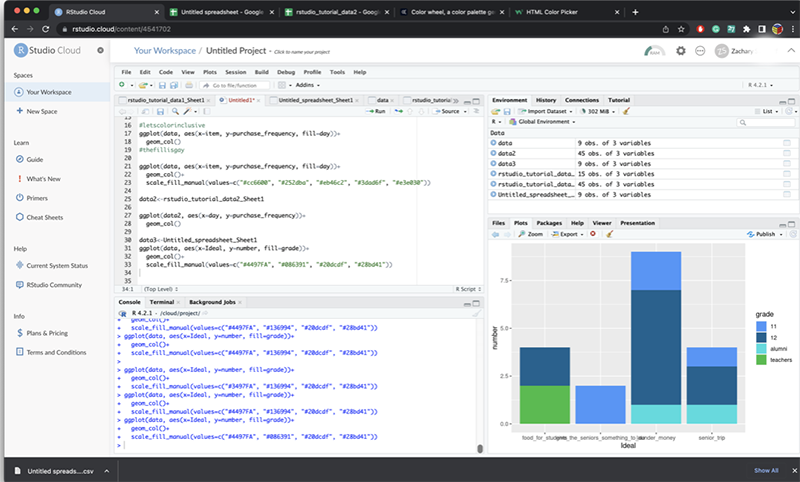
Coding has become such an important part of how our world works that I started to look at bringing it into my Humanities curriculum. Our high school students are not necessarily experiencing coding unless they’re members of the Robotics Club or pursuing an independent interest, and yet a general knowledge of how code works is essential for our graduates.
Confession, I am no coder. I took one rStudio class in college and it was really hard for me. So I called up my sister, an alumna of the class of 2017, who works in a plant science lab at Stanford and asked her if she would be willing to Zoom in for a demo with my 12th grade Economics students. We came up with an ideal exercise: 12th Graders would use R code to create visual representations of data they’ve been collecting for their Economics work. Each student worked through an example where they followed her through importing the data, adding instructions, and running different lines of code. They each ended up with a colorful graph that matched hers. Their homework was to ask a question related to the research they needed to do for their Senior store, collect their own data, and create their own graphs from those data. Did everyone figure out each part perfectly? No. Did everyone create a graph? Yes.
A big part of this education is building capacities. With each new task students do, they work through something. Visualizing data is a new skill that I hope opens their minds to what they believe they can do, however daunting it first appears to be.
by Dr. Lisa Babinet | Middle and High School Math Faculty
Being able to capture phenomena in the world with numerical data is a powerful skill. Traditionally, sixth graders undertake just that by embarking on a statistics research project with a topic of their choosing. The more interested the students are in the topic, the more fun they have with their project. Students are given guidelines to create a survey, collect data from their peers, and then find participants to complete their survey. Once their data is collected, students calculate basic statistics and create beautiful, varied tables, charts, and graphs capturing the essence of their findings. This project empowers the students to know they can study the world around them, often leading to a desire to ask more questions.
P.S. They’re practicing decimals, fractions, and percents throughout this project with information that is meaningful to them, which is an added bonus!
Here is what they found. Of the people they surveyed:
Maya learned from the process that if you can’t answer the question yourself, you should not put it on your survey.
Tessa learned that the majority of people liked vanilla ice cream.
Matvei learned that on a scale from 1 to 10, 1/3 of them liked music 10 out of 10.
Misha learned that more than 80 percent of the people ate breakfast every day.
Mai learned that most people traveled within the United States.
Rhea learned that teachers were the ones who got into the most mischief.
Amira learned that most of them dislike homework.
Ava learned that most people read and/or draw before they go to bed, and that only one person cries before they go to bed.
Yumeng learned that two people said they had “Deuaphobia.” She is pretty sure that is not a legit phobia, but if it is, she deeply apologizes.
Jack learned that so many people like basketball.
Sepehr learned that some people think hip hop is a sport.
Felix learned that a very large number liked to use graphite pencils to draw.
Spencer learned that someone never wants to eat deep fried care glow worm fritters again.
Jordan learned that a lot of people like Halloween and that they save their Halloween candy.
Jenna learned that most teachers spend $100 – $150 per shopping trip on clothing.
Luisa learned that most liked chicken tacos the best.
Gloria learned that most people wear five outfits in a school week.
Caedence learned that the reason 40% own or don’t own pets is because of their parents.
Jasleen learned that the majority of them absolutely love pets.
Jasper learned that a lot of people play basketball.
Clara learned that most people liked to fill out surveys and don’t like completing their statistics project. Dr. Babinet begs to differ.