by Ashley Brickeen | Admissions Director, Nursery-Grade 8
Imagine your child learning a coding language that could be read, used and accurately executed hundreds of years into the future. That is knitting. Hundreds of years before computer coding, fiber artists had created a symbolic language that could be used by knitters, crocheters and weavers anywhere in the world to reliably create clothing, blankets and toys. With knitting, the code is based on K (knit) or P (purl) stitches rather than zeros and ones.
At its most basic, knitting is executing an algorithm. An algorithm is a set of steps used to complete a specific task. Students are given a code (knitting pattern) and they carefully translate the code, executing the functions in the code line by line, row by row. Knitting patterns often include looping instructions, similar to a while loop in coding.
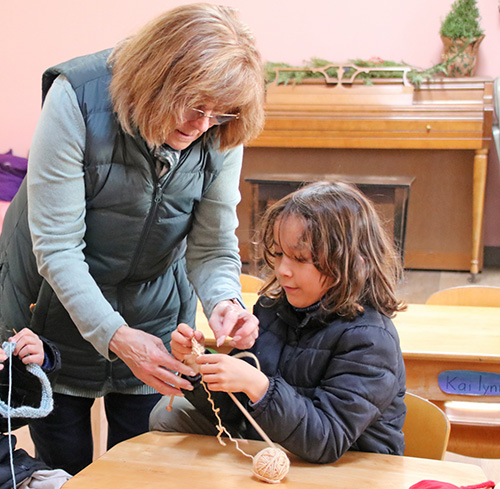
At Waldorf Schools, we introduce students to knitting in first grade. Knitting strengthens the muscles of the hand, requires focused attention, and reinforces the mathematics students learn in their main lesson. In the early grades, students add and reduce rows and stitches, follow ratios and use mathematics to calculate gauge (variables that must be adjusted to ensure that their sock fits). Whether knitting, crocheting, or weaving, all of these patterns (codes) are executed line by line, row by row, as with computer coding.
In fifth grade, we introduce variables into the knitting pattern/code, much like a variable in a coding language. Pattern authors will create one pattern which will make an object of a certain size – for example, a pair of socks that will fit a medium-sized foot. Students, working with their teacher, learn how to replace certain variables within the pattern/code to make the final product the proper size. After weeks of careful, attentive work, they have the final creation – a beautiful sock, sized to fit their foot.
This relationship between fiber arts and coding is not accidental. The work of fiber artists and the patterns they created led directly to computer code. In the early 1800s, the Jacquard loom used a punch card system (hole/no hole) to create elaborate textile patterns. Mathematician Ada Lovelace was inspired by this process when she created what is considered the first example of computer programming, famously stating that “The Analytical Engine [the theoretical calculating machine] weaves algebraic patterns, just as the Jacquard-loom weaves flowers and leaves.” She pointed out that this binary process could be used for all sorts of complex calculations and in numerous fields of human endeavor.
While teachers do not make the linkage between fiber arts and computer coding languages explicit to our students, the knitters are still absorbing the lesson through the physical experience of knitting and crocheting, laying the groundwork for their future understanding when they do encounter their first computer language. Nowadays, this sort of learning is often called embodied cognition, a field of research which recognizes that the sensory and motor [movement] systems of the body are fundamentally integrated into cognition. While the field of embodied cognition is relatively new, Waldorf Education has worked out of the framework of embodied learning since its inception in 1919.
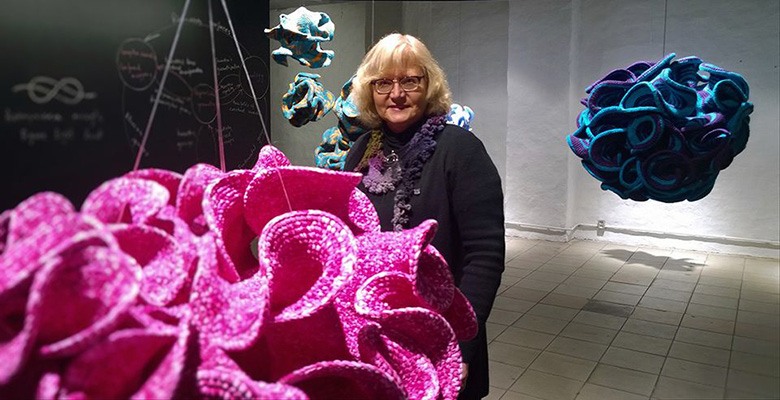
These embodied experiences can lead to major discoveries. In 1997, mathematician Dr. Daina Taimina attended a geometry workshop on the hyperbolic plane. Stated simply, hyperbolic geometry is used by statisticians when they work with multidimensional data and acoustic engineers when they design concert halls, among other things. At this time, mathematicians were unable to represent hyperbolic space physically. In the field of mathematics, hyperbolic space existed only in principle. What allowed Dr. Taimina to solve this problem while she sat in that lecture hall? She is an avid crocheter. While she had always seen algorithms and patterns in her crocheting, she now saw how she could easily create a physical model of hyperbolic space with yarn and a crochet hook.
Of course, as with so much in Waldorf Education, the handwork curriculum works within a student physically, emotionally, and intellectually. It develops aspects of character – patience, emotional resilience, and tenacity. It also lays the foundations for future learning and growth.
For more reading, see
Crocheting Adventures with Hyperbolic Planes: Tactile Mathematics, Art and Craft for all to Explore, Second Edition by Dr. Daina Taimina
Making Mathematics with Needlework: Ten Papers and Ten Projects by Dr. Sarah-Marie Belcastro
Siobhan Roberts, SR. (2019) ‘Knitting Is Coding’ and Yarn Is Programmable in This Physics Lab For Elisabetta Matsumoto, knot theory is knit theory, New York Times, May 17, 2019. Available here.
by Dr. Lisa Babinet | Middle and High School Math Faculty
Being able to capture phenomena in the world with numerical data is a powerful skill. Traditionally, sixth graders undertake just that by embarking on a statistics research project with a topic of their choosing. The more interested the students are in the topic, the more fun they have with their project. Students are given guidelines to create a survey, collect data from their peers, and then find participants to complete their survey. Once their data is collected, students calculate basic statistics and create beautiful, varied tables, charts, and graphs capturing the essence of their findings. This project empowers the students to know they can study the world around them, often leading to a desire to ask more questions.
P.S. They’re practicing decimals, fractions, and percents throughout this project with information that is meaningful to them, which is an added bonus!
Here is what they found. Of the people they surveyed:
Maya learned from the process that if you can’t answer the question yourself, you should not put it on your survey.
Tessa learned that the majority of people liked vanilla ice cream.
Matvei learned that on a scale from 1 to 10, 1/3 of them liked music 10 out of 10.
Misha learned that more than 80 percent of the people ate breakfast every day.
Mai learned that most people traveled within the United States.
Rhea learned that teachers were the ones who got into the most mischief.
Amira learned that most of them dislike homework.
Ava learned that most people read and/or draw before they go to bed, and that only one person cries before they go to bed.
Yumeng learned that two people said they had “Deuaphobia.” She is pretty sure that is not a legit phobia, but if it is, she deeply apologizes.
Jack learned that so many people like basketball.
Sepehr learned that some people think hip hop is a sport.
Felix learned that a very large number liked to use graphite pencils to draw.
Spencer learned that someone never wants to eat deep fried care glow worm fritters again.
Jordan learned that a lot of people like Halloween and that they save their Halloween candy.
Jenna learned that most teachers spend $100 – $150 per shopping trip on clothing.
Luisa learned that most liked chicken tacos the best.
Gloria learned that most people wear five outfits in a school week.
Caedence learned that the reason 40% own or don’t own pets is because of their parents.
Jasleen learned that the majority of them absolutely love pets.
Jasper learned that a lot of people play basketball.
Clara learned that most people liked to fill out surveys and don’t like completing their statistics project. Dr. Babinet begs to differ.
Every year in the sixth-grade math class, the students undertake a statistics project of their own choosing, learning to perceive the world through a numerical lens while using basic statistics and creating graphs and charts. This project brings joy and meaning to their strengthening their facility with fractions, decimals, and percentages. This year, the seventh-grade students took on a mini project where they learned about percentiles, quartiles, the interquartile range, stem and leaf plots, box and whisker plots, and standard deviation. Their deeper foray into statistics had plenty of COVID-related statistical examples to deepen their understanding and appreciation of how valuable statistics can be.
In the sixth grade, of the people they surveyed:
Parnavi learned that most did not want to leash train their cat.
Gabriel found that the most common breed of chickens is Ameraucana.
Laszlo found a lot of people didn’t like many toppings on their burgers.
Nathan found only one didn’t like lemonade.
Sacha found most people felt at least a little bad when taking breaks.
Max found many people thought that singing would be boring.
Juliette found not many people practice ballet, and basically half do not like it.
Ilham found most people had only seen a little bit of anime and gave it a good rating.
Omer found that a lot of people like animals.
Rosalia found many people think climate change is urgent but do not know much about it or how to reverse it.
Thomas found most liked entertainment from chickens.
Shaylana found a lot of people like hip hop.
Mascha found most liked sports a lot.
Grace found mostly either they did a lot of dance or no dance at all.
Neel found most have dogs.
Rose found, on a scale of one to ten, not many people rated that they liked pink more than a score of 5.
Greta found not many read a lot of books.
In the seventh grade, of the people they surveyed:
Brian found most people have been on their screens a lot more during the pandemic.
Isabella found that they liked The Counter and In-N-Out Burger best.
Samanyu found that the ones who thought they were lazy also assumed other people to be lazy as well.
Tobin found that the 13-year-olds he surveyed liked to meme.
Samih found that they liked movies, and thought Marvel is better than D.C. (96% to 4%).
Arnav found that they had no idea how much a car costs.
Sky found that most of them liked pineapple on their pizza.
Paulette found that those who owned more shoes would pay a lower price for shoes, and those with one pair would purchase very expensive shoes.
Sam found that no one hated TV shows.
Meera found that they only wanted 3, 4 or 5 days of school per week.
Audrey found that most people knew the song We Will Rock You, but not the band who played it.
Daphne found 5 out of 30 people knew how many brain cells they had (approximately).
Jordan found that most people make a lot of mistakes, but aren’t very forgetful.
 At Waldorf Schools, we introduce students to knitting in first grade. Knitting strengthens the muscles of the hand, requires focused attention, and reinforces the mathematics students learn in their main lesson. In the early grades, students add and reduce rows and stitches, follow ratios and use mathematics to calculate gauge (variables that must be adjusted to ensure that their sock fits). Whether knitting, crocheting, or weaving, all of these patterns (codes) are executed line by line, row by row, as with computer coding.
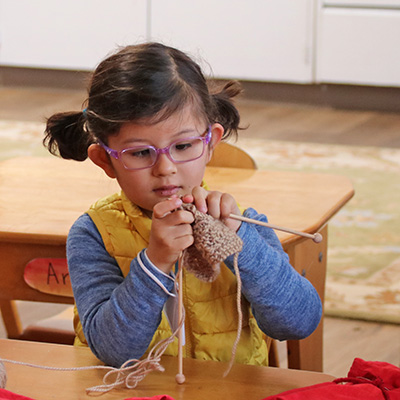 While teachers do not make the linkage between fiber arts and computer coding languages explicit to our students, the knitters are still absorbing the lesson through the physical experience of knitting and crocheting, laying the groundwork for their future understanding when they do encounter their first computer language. Nowadays, this sort of learning is often called embodied cognition, a field of research which recognizes that the sensory and motor [movement] systems of the body are fundamentally integrated into cognition. While the field of embodied cognition is relatively new, Waldorf Education has worked out of the framework of embodied learning since its inception in 1919.